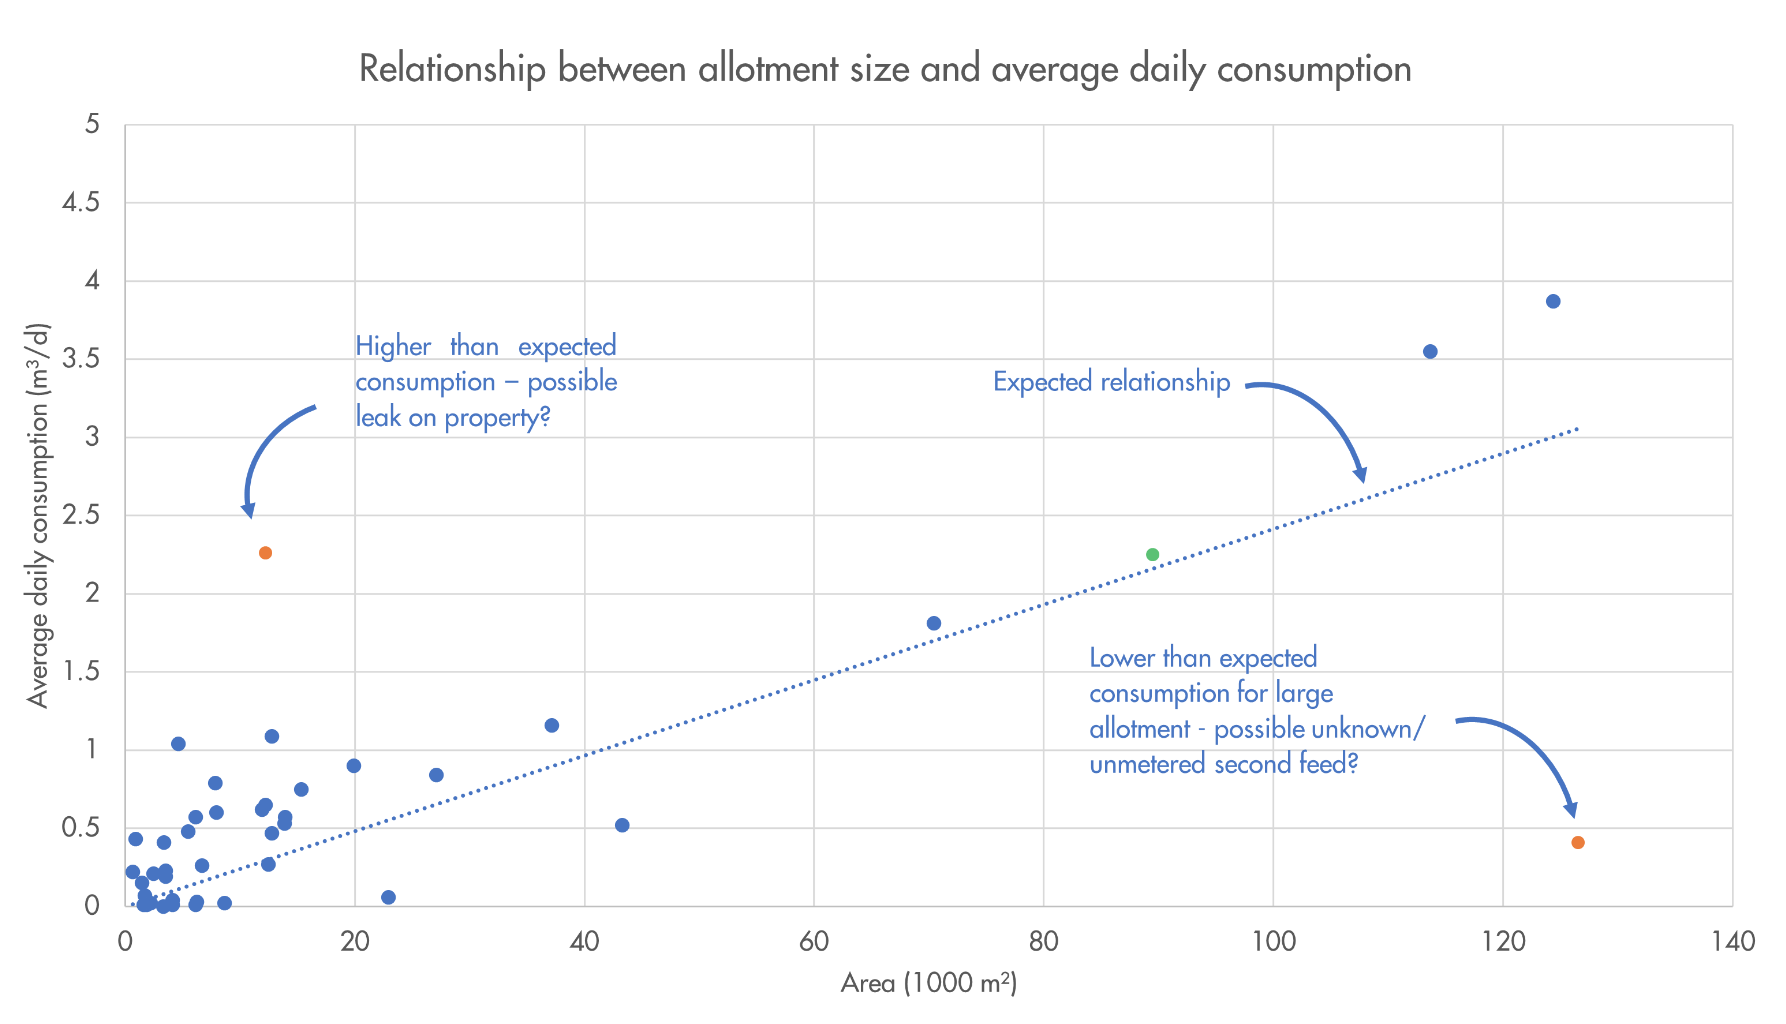
Figure iii. Relationship between allotment size and billed average daily consumption
The scatter plot in figure iii. shows a positive linear relationship, demonstrating how typical daily consumption should be expected to increase with allotment size. There are a significant number of allotments with a total area below 10,000 m², and of these a handful have lower than expected consumption values; it may be that these properties are no longer in use or have meter issues.
Those highlighted in orange are clear outliers, but possible issues at these sites may offer insights that could benefit the development of Paradigm as well as delivering insights for leakage teams. By identifying allotments that do not follow the expected trend it is possible to hypothesise the causes. For the allotment displaying higher than expected consumption for its size, it would be beneficial to check the site for possible customer side leakage, or for any users that are creating increased demand. On the opposite end of the scale, the allotment that has an average daily consumption of ~0.5 m³/d despite being the largest in the sample could have a second feed that is currently unknown or unmetered, or a meter fault that is causing it to under record. Investigating these allotments could yield benefits by helping to account for UFW within the DMAs and reduce reported leakage.
Without the use of the Overpass Turbo mined data it would be very difficult to understand which allotments were using more or less water than expected. If the average daily consumption was analysed alone, it would highlight those at the upper end of the scale as being outliers, when in reality they fit well within the expected trend.
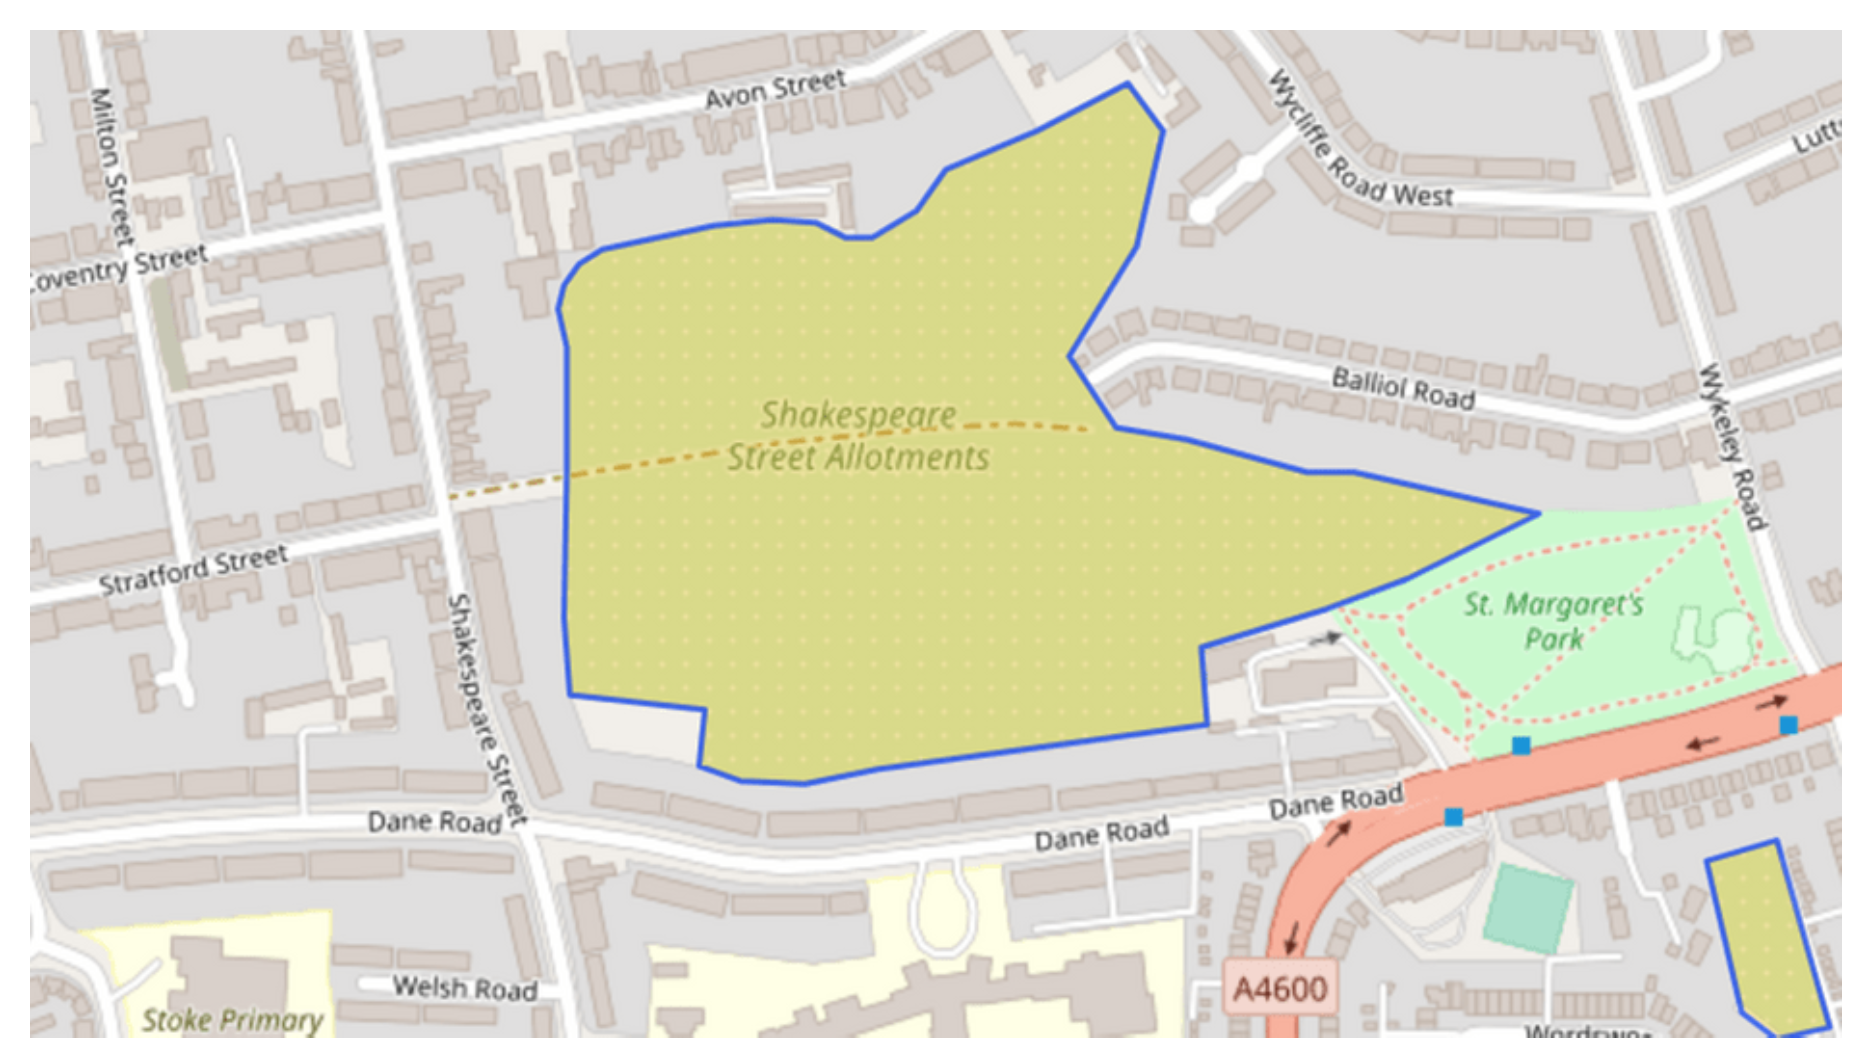
By applying this relationship to the allotment found within the DMA in figure i., the expected average daily consumption value would be as denoted by the green highlighted plot in figure iii. Using the OpenStreetMap data this allotment has a calculated area of ~90,000 m², which when compared with other matched allotments would give an expected consumption of approximately 2.25 m³/d. It will be interesting to see whether the consumption now being measured at the site is comparable with the expected values once enough flow data has been recorded.
Can open-source data benefit Paradigm?
Whilst this investigation has been on a relatively small scale, it seems that using open-source data such as the Overpass Turbo tool could prove invaluable to building hypotheses and components for Paradigm. The tool itself is user friendly and returns data quickly, often with extra attributes such as property owners and facilities on site. The ability to set designated boundaries can also allow for analysis to be done in specific locations, which means that the scope could be extended to other water companies, increasing the sample size greatly.
Useful initial insights into the allotment size/consumption relationship have been observed, but the spatial data itself could be useful to water companies when trying to identify previously unknown allotments. There is clearly a gap in customer data quality, so any tools that could assist in finding and accounting for allotment consumption could provide benefits before using Paradigm to investigate remaining UFW.
Furthermore, losing 1 m³/day to unaccounted for water will equate to a revenue loss of approximately £1000/year for a typical water and sewerage company. Taking the examples shown in Figure iii., expected losses for the allotment that is under recording, and the site that is not currently being billed would be approximately £2000/year per property. When this potential benefit is quantified, it demonstrates how resolving these issues could present a large benefit in the short term for water companies, as well as presenting a means of prioritising allotment investigation. Increasing the number of billed allotment sites would further improve the sample for deriving an expected allotment consumption component in Paradigm.
To conclude, I feel that utilising this type of data will be beneficial to the development of Paradigm and could have a wide range of applications in the future as more hypotheses and requirements are added to the model.