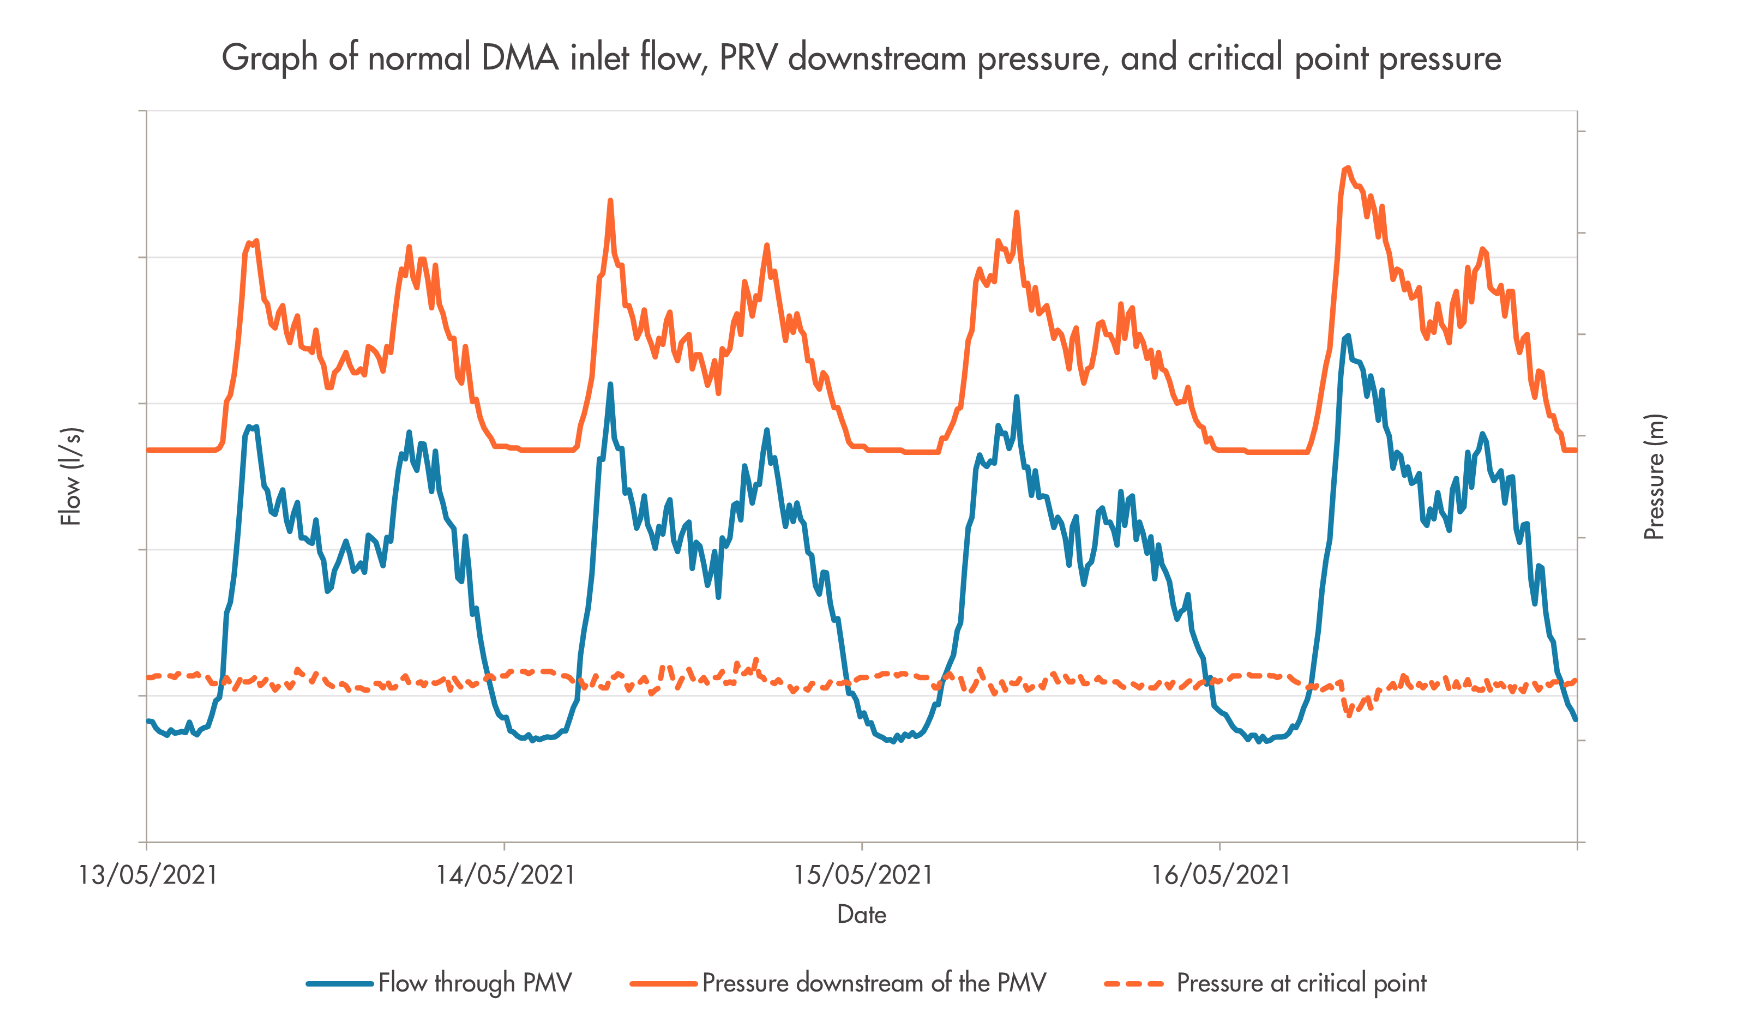
Figure 2: Graph of abnormal DMA inlet flow, PRV downstream pressure, and critical point pressure
Enter Dynamo
What the system highlighted for us was that there were spikes in water consumption far closer to the inlet than had been expected. While there were no logged users close to the inlet, the system gave us confidence that there were intermittent flows of relatively consistent size and duration close to the inlet that we saw no evidence of further into the DMA, and so we took to Google Earth to have a look at whether we could find any possible causes.
Satellite images showed us that the area between the inlet and the village was given over to arable farming and that there were a number of greenhouses and polytunnels close to the inlet. This led us to believe there could well be an unlogged user somewhere between the inlet and the critical point that was responsible for the spikes in flow.
As previously mentioned, Dynamo’s analysis of head loss along the 3 km of mains between the inlet and village had suggested a figure of around 10 m. This would have been significantly lower for a hypothetical unlogged user close to the inlet, leading us to our ‘lightbulb moment’.
When an unlogged user started to draw water from the system near to the inlet the network controller responded correctly, by increasing the outlet pressure of the PRV. However, it had been calibrated to adjust for the head losses experienced along the 3 km of mains pipe leading to the local village. Given the head losses between the inlet and hypothetical user would be far lower, the network controller was incorrectly attempting to overcome a 10 m head loss that was not actually present, causing the spikes in pressure seen at the critical point.
Conclusion
Once we had what appeared to be a solid theory supported by Dynamo’s localisation of the anomaly as well as the satellite images, we presented the case study to the client who was quick to log the customer we had identified as being the probable cause of the spikes. They identified that the customer was regularly drawing the 3 l/s that we were seeing at the inlet, confirming our theory.
The problem of maintaining a constant pressure at the critical point would appear to be a difficult one to solve on the face of it without a rezoning of the DMA. How could you program a network controller to differentiate between a sudden draw very close by from one the other side of the DMA, as both require differing responses (depending on the amount of head loss incurred between the two)?
The client was pleased with the analysis and has been looking into how best to make improvements to the configuration of the network. For us, Dynamo again demonstrated its value in determining where anomalies were occurring on a network.