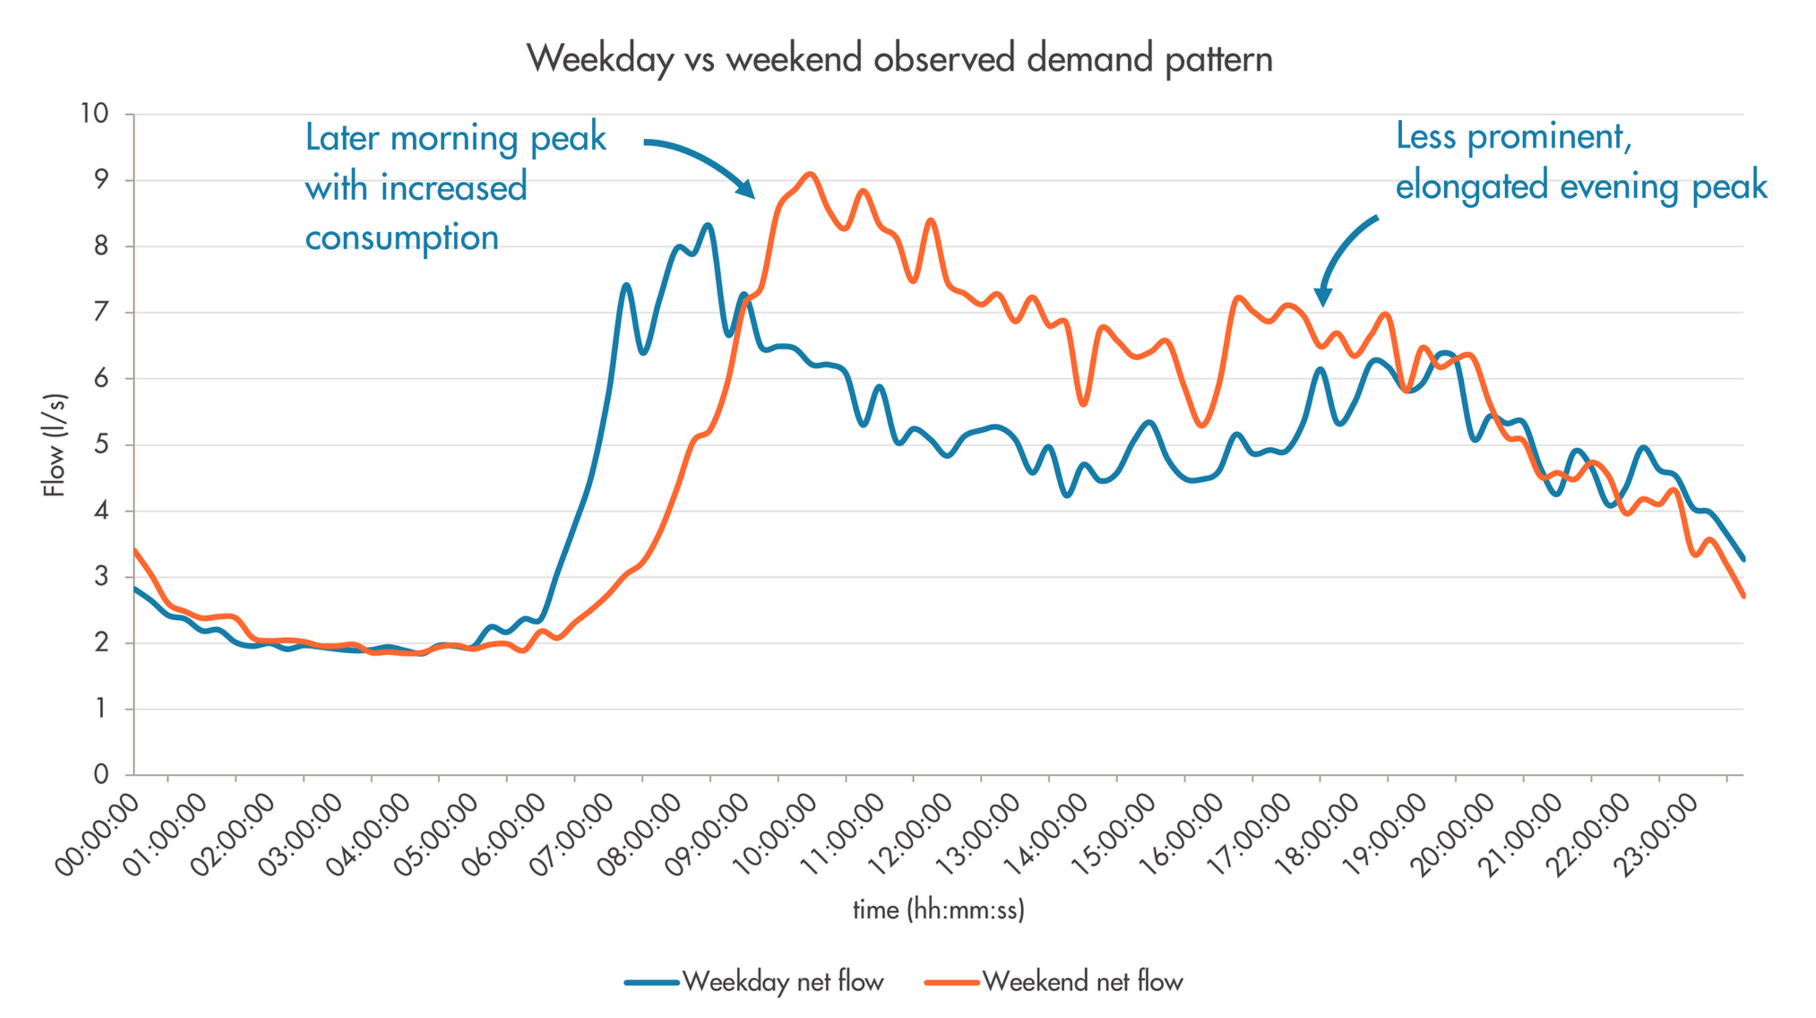
Figure 1: Comparison of typical weekday and weekend DMA net flow
It seems that household demand also differs in the evenings during weekends, as strong peaks (typically between 19:00 and 19:30) make way for lower and elongated profiles with a less dramatic drop off in consumption going into the night. Although the shape of the evening profile changes there is no real shift in the volume of water being used; this can most likely be attributed to a change in behaviour from a typical weekday.
It was also noted that night use during weekends was often elevated and displayed more erratic behaviour. When testing Paradigm’s expected profiles, we found that flow rates on Friday and Saturday nights could show a discrepancy of up to 3 m³/hr between predictive and observed net flows. Despite the expected profiles being derived using average daily consumption values, it is clear that for some DMAs this can lead to under-representation across weekends. The residual shape between expected and observed net flow shows inconsistent spikes in demand, which indicates that this usage is most likely to originate from non-household customers.
Why does this shift in demand occur?
When looking purely at the data, such dramatic changes in net flow profiles between weekdays and weekends may give the impression that there is a possible event on the network, or unknown users are creating periods of high demand within the DMA. However, the more likely scenario is that changes in peoples daily routine is having a great effect on the overall demand pattern. Small alterations, such as not having to wake up to an alarm at the weekend, having time for an extra cup of tea or time to load the washing machine in the morning, can have a surprisingly dramatic effect. Especially if you consider that this could be multiplied by 1500-2000 household properties within a single DMA. Suddenly what seems like a trivial amount of extra consumption can create a totally different morning peak when viewed on a net flow profile.
The same can also be true for the changes in evening demand. Usually in the week most people will arrive home after their commute and have a structured evening and consistent bedtime routine. At the weekend however, people may stay up later, especially families with school age children, and this can create a less dramatic evening peak (as observed in Figure 1).
Changes in evening and night-time activities at weekends can also affect the non-household demand profile. During the weekend, it is much more common for people to eat out at restaurants or go to bars or clubs for drinks. This can have a knock-on effect on night use, especially in DMAs within town centres. In this case, a DMA may have a temporary influx of people travelling into town, which would result in an increased demand not normally seen on a weekday night. There may also be certain businesses that are more active during weekends, causing an increase in consumption across the weekend period which may explain the more erratic night use observed.
How could weekend demand cause a problem?
There is still a large amount of customer routine during weekends, with consistent shape profiles and volumes of consumption when compared week on week. When weekdays aren’t taken into consideration the observed profiles can look relatively similar. So why is understanding the variation between weekday and weekend demand important, and how could weekend demand in particular cause a problem for water companies?
Historically, UK water companies have not had to use weekend data when reporting leakage figures, as there was no universal requirement for which days were factored into the calculation. As part of AMP7 requirements water companies now must take the mean of all days within the week, meaning the higher weekend net flow values have to be included in the reporting calculations. Previously it was acceptable to use median values or to take an average of the ‘middle 3’ days of the week by consumption; the nature of using this methodology would then avoid factoring in weekend net flow values as the increased demand would leave them as outliers.
When aggregated to an average week value and then to an average yearly value, this change in methodology could result in a sudden jump in reported leakage figures. For the DMA shown in Figure 1 alone, a change from reporting based on median weekly values to a seven-day average would create an average annual increase of 8.6 m³/d. If this were to be taken as an average increase for all DMAs, assuming 1000 other DMAs within a company had similar weekday and weekend variations, reported leakage would rise by 8.6 Ml/d, purely due to weekend demand not being fully understood.
Conclusion – How Paradigm could help
By deriving expected profiles for both weekdays and weekends, Paradigm can help to improve the understanding of how weekends differ, and therefore allow water companies to be able to account for this marginal increase in consumption. Without this knowledge there is a risk that perfectly normal changes in demand could be attributed to a rise in leakage within a DMA, and this could then have a greater effect on total reported leakage which could determine whether or not a company reaches its leakage target.
In addition to applying changes to expected profiles at weekday/weekend level, included in Paradigm’s ‘secondary’ components are term time, student semester, Ramadan, and weather-related transformations. All factors that can bring benefits to understanding demand changes that are at risk of being dismissed as leakage.