As water companies look to make their networks smarter to meet the AMP7 leakage target, the number of sensors deployed on their networks continues to grow. With the associated data collection and analysis becoming an integral tool for leak detection efforts, this blog will look at how Dynamo makes varied use of available pressure data to, not only direct teams in the field to the source of demand or burst events, but to provide invaluable network understanding.
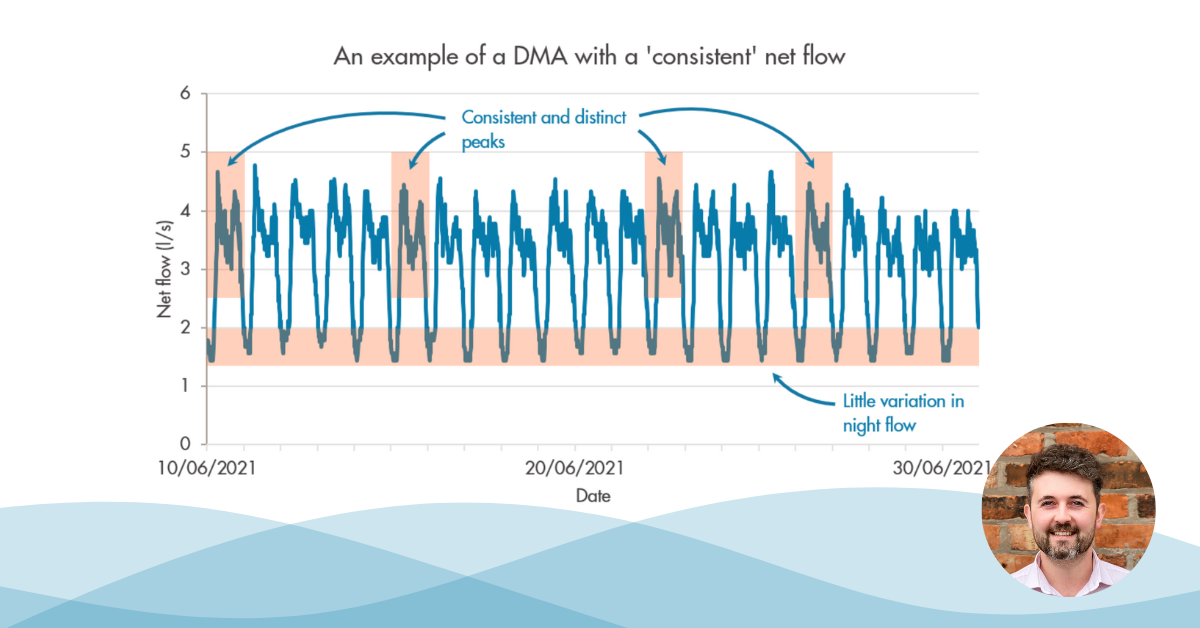
Some of our previous blogs have highlighted Dynamo’s use of pressure data to find bursts several times in the past, but to recap: Dynamo is capable of providing a localisation of unusual flows in a DMA by analysing the relationship between data from pairs of loggers placed at strategic points around a network. By combining pairs of loggers we create what we refer to as a flow path. Once the system has acquainted itself with the ‘normal’ pattern of flows expected on a flow path it can raise an alert when abnormal behaviour is detected. Once we have formed a comprehensive web of flow paths throughout the DMA, analysing the data allows us to determine (in near real-time) when one section of a DMA has seen abnormal flow. When we see the timing of this abnormal flow correspond to a measured increase at the inlet meter, we have our localisation of the source.
Additional network insight using Dynamo
So, we’ve seen that by analysing flow path data we can provide useful localisations to leakage teams hunting for the source of unusually high flow, but what else can pressure data tell us?
For one, it can tell us whether an area is configured as expected. Flow path data reveals the direction which water is travelling on a network. This can be extremely useful for locating unrecorded network changes, such as closed valves mid-DMA that have caused the flow to travel in unexpected directions.
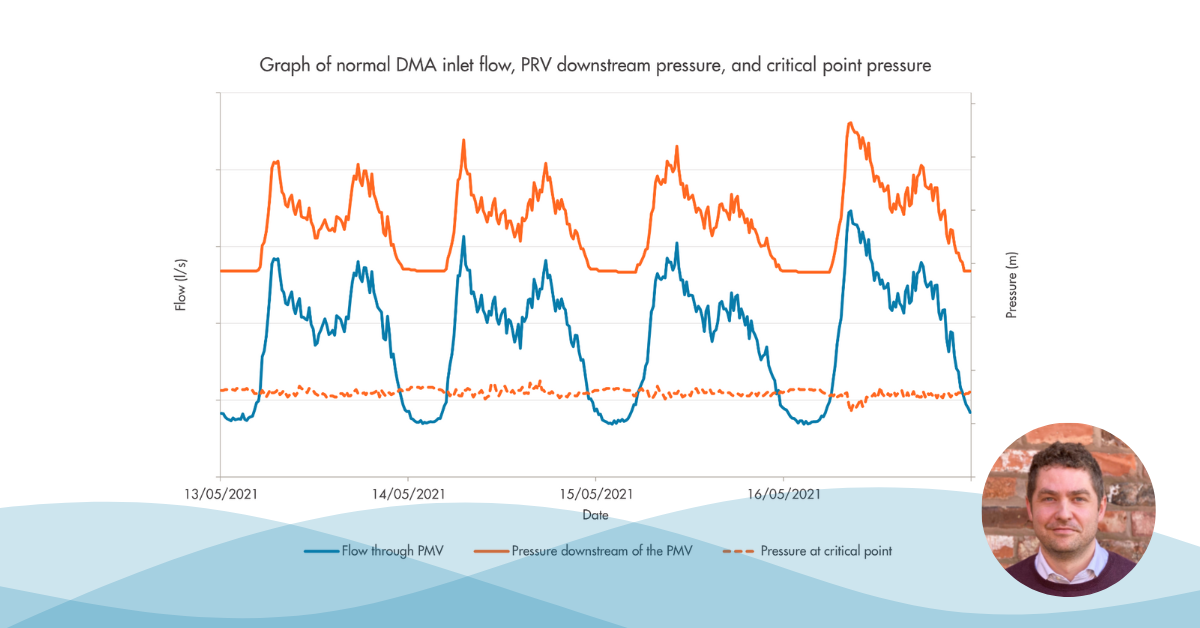
Significantly, the pressure data received by Dynamo from around the DMA allows us to confirm accuracy of the logged data from each individual sensor. By comparing each sensor’s output to that of all others in the same pressure regime, we can quickly see if one has started to drift and then raise maintenance accordingly. This stands in comparison to the situation that leakage analysts have undoubtedly been left with in the past, where the story being told by a critical point and an inlet pressure sensor start to diverge. Which is correct?
This correlation of data from numerous pressure sensors has also proven to be beneficial in detecting breaches between areas. When a boundary valve is opened it impacts the direction of flow as the pressure regime of one area influences that of another. In a recent example, we saw minimum night flow ascend by around 1 l/s over the course of two days in one area, but could find no obvious localisation for the increased flow. The increase had been preceded by a sudden spike in flow that had registered as a sudden dip in pressure across the DMA. As all pressure data is timestamped, we could see very clearly the time at which things started to go awry, but still no localisation. Further analysis revealed that there had been a change in flow direction near the DMA boundary and that a dip in pressure had been recorded across one of the neighbouring DMAs at the same point in time. This gave us confidence that we were looking at a breach between two areas. Not only that, with just one boundary valve in the vicinity, we could identify (with a high degree of certainty) where the network change had been made.
Conclusion
With smart networks generally regarded as the future of leakage detection, the versatility of pressure data makes it an attractive solution to those interested in the rapid identification of anomalous behaviour on a network. As has been discussed, the additional benefits to network understanding are varied and not to be sniffed at. The correct interpretation of the relationships between pressure data from around a DMA can yield a number of unexpected revelations about a network, above and beyond whether a critical point has enough pressure or whether a PRV has been configured accurately.